Present your event's figures with Smart Reports
Turn your attendees and orders into a report of slides with headline figures, charts and pivot tables, then present, download or share it with today's figures.
Where to find it: Event admin › Smart Reports
Smart Reports turns your attendees and orders into a report of slides: headline figures, charts and pivot tables, in a theme you choose. A report keeps its design, not its figures, so every time you open it, it shows the registrations as they are now. Use it for a sponsor update, a board meeting or the post-event wrap-up.
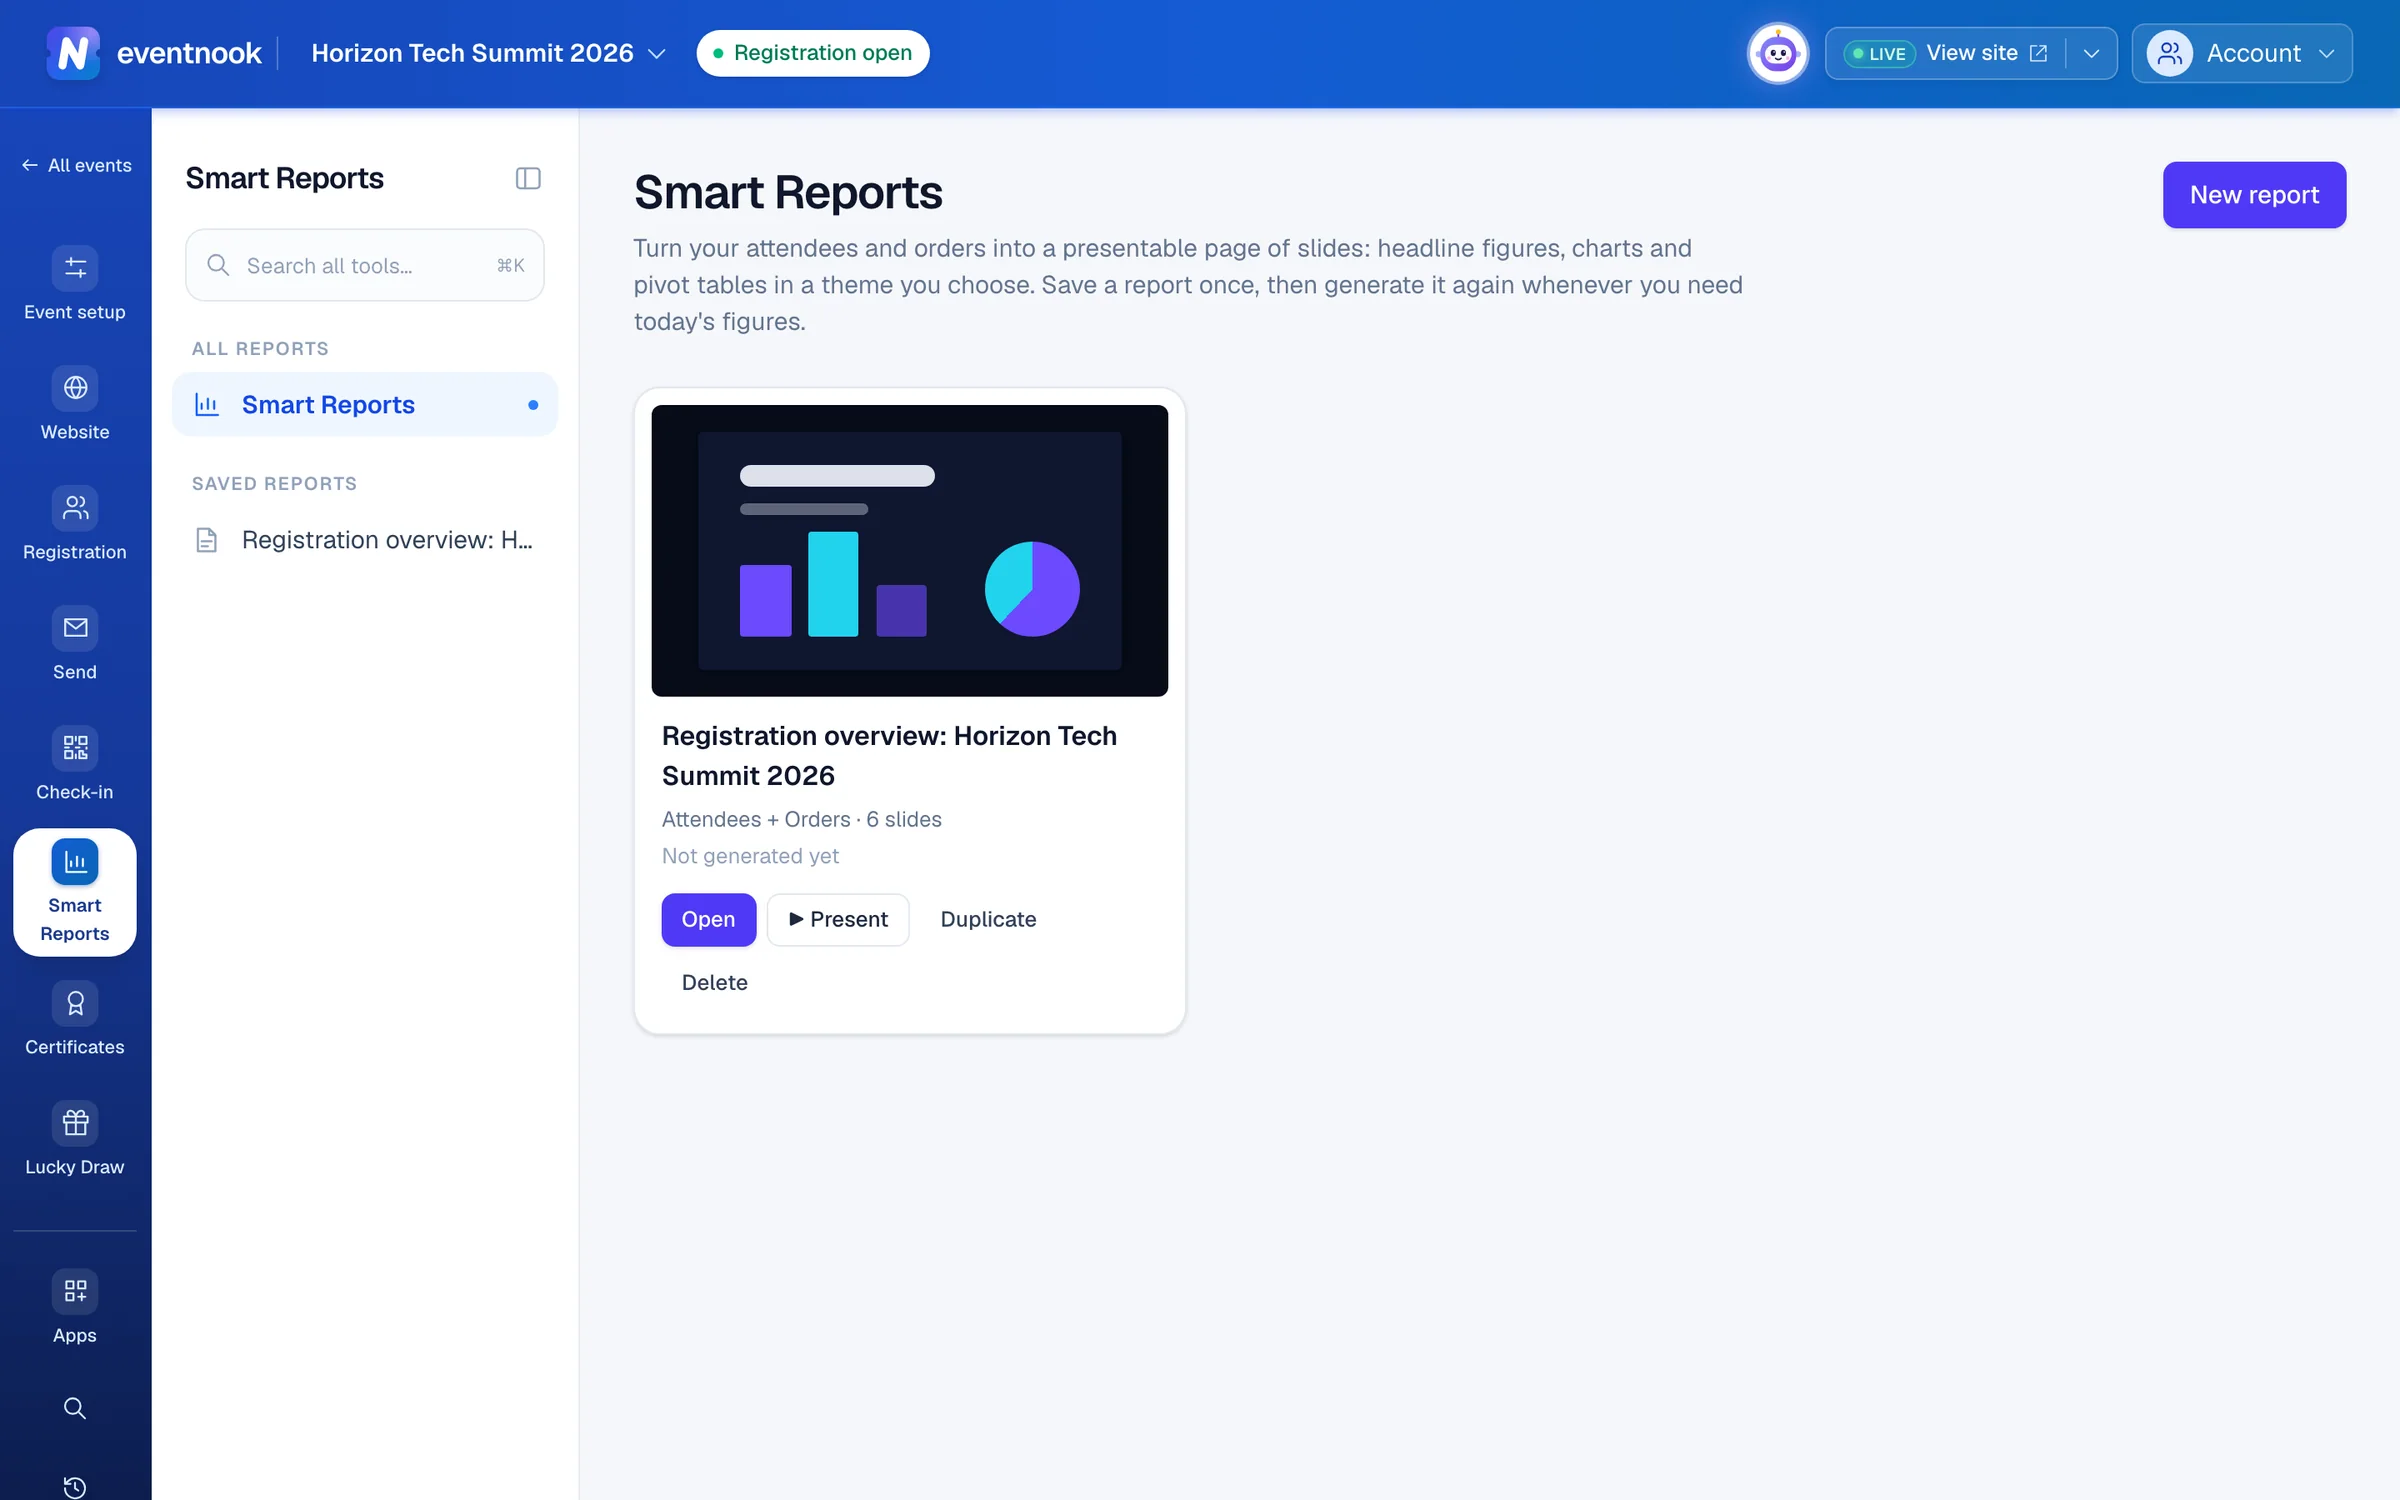
- 1Start a report from a ready-made one
Add the app to your event#
Smart Reports is an add-on app. Open Apps, find Smart Reports under Data & automation and click Add to this event. The event's menu then has a Smart Reports tab for the whole team, with All reports and your saved reports listed by name.
If Apps shows Smart Reports under Not in your plan, your organisation doesn't have it yet: ask EventNook to add it. See Add an app to your event.
Make a report#
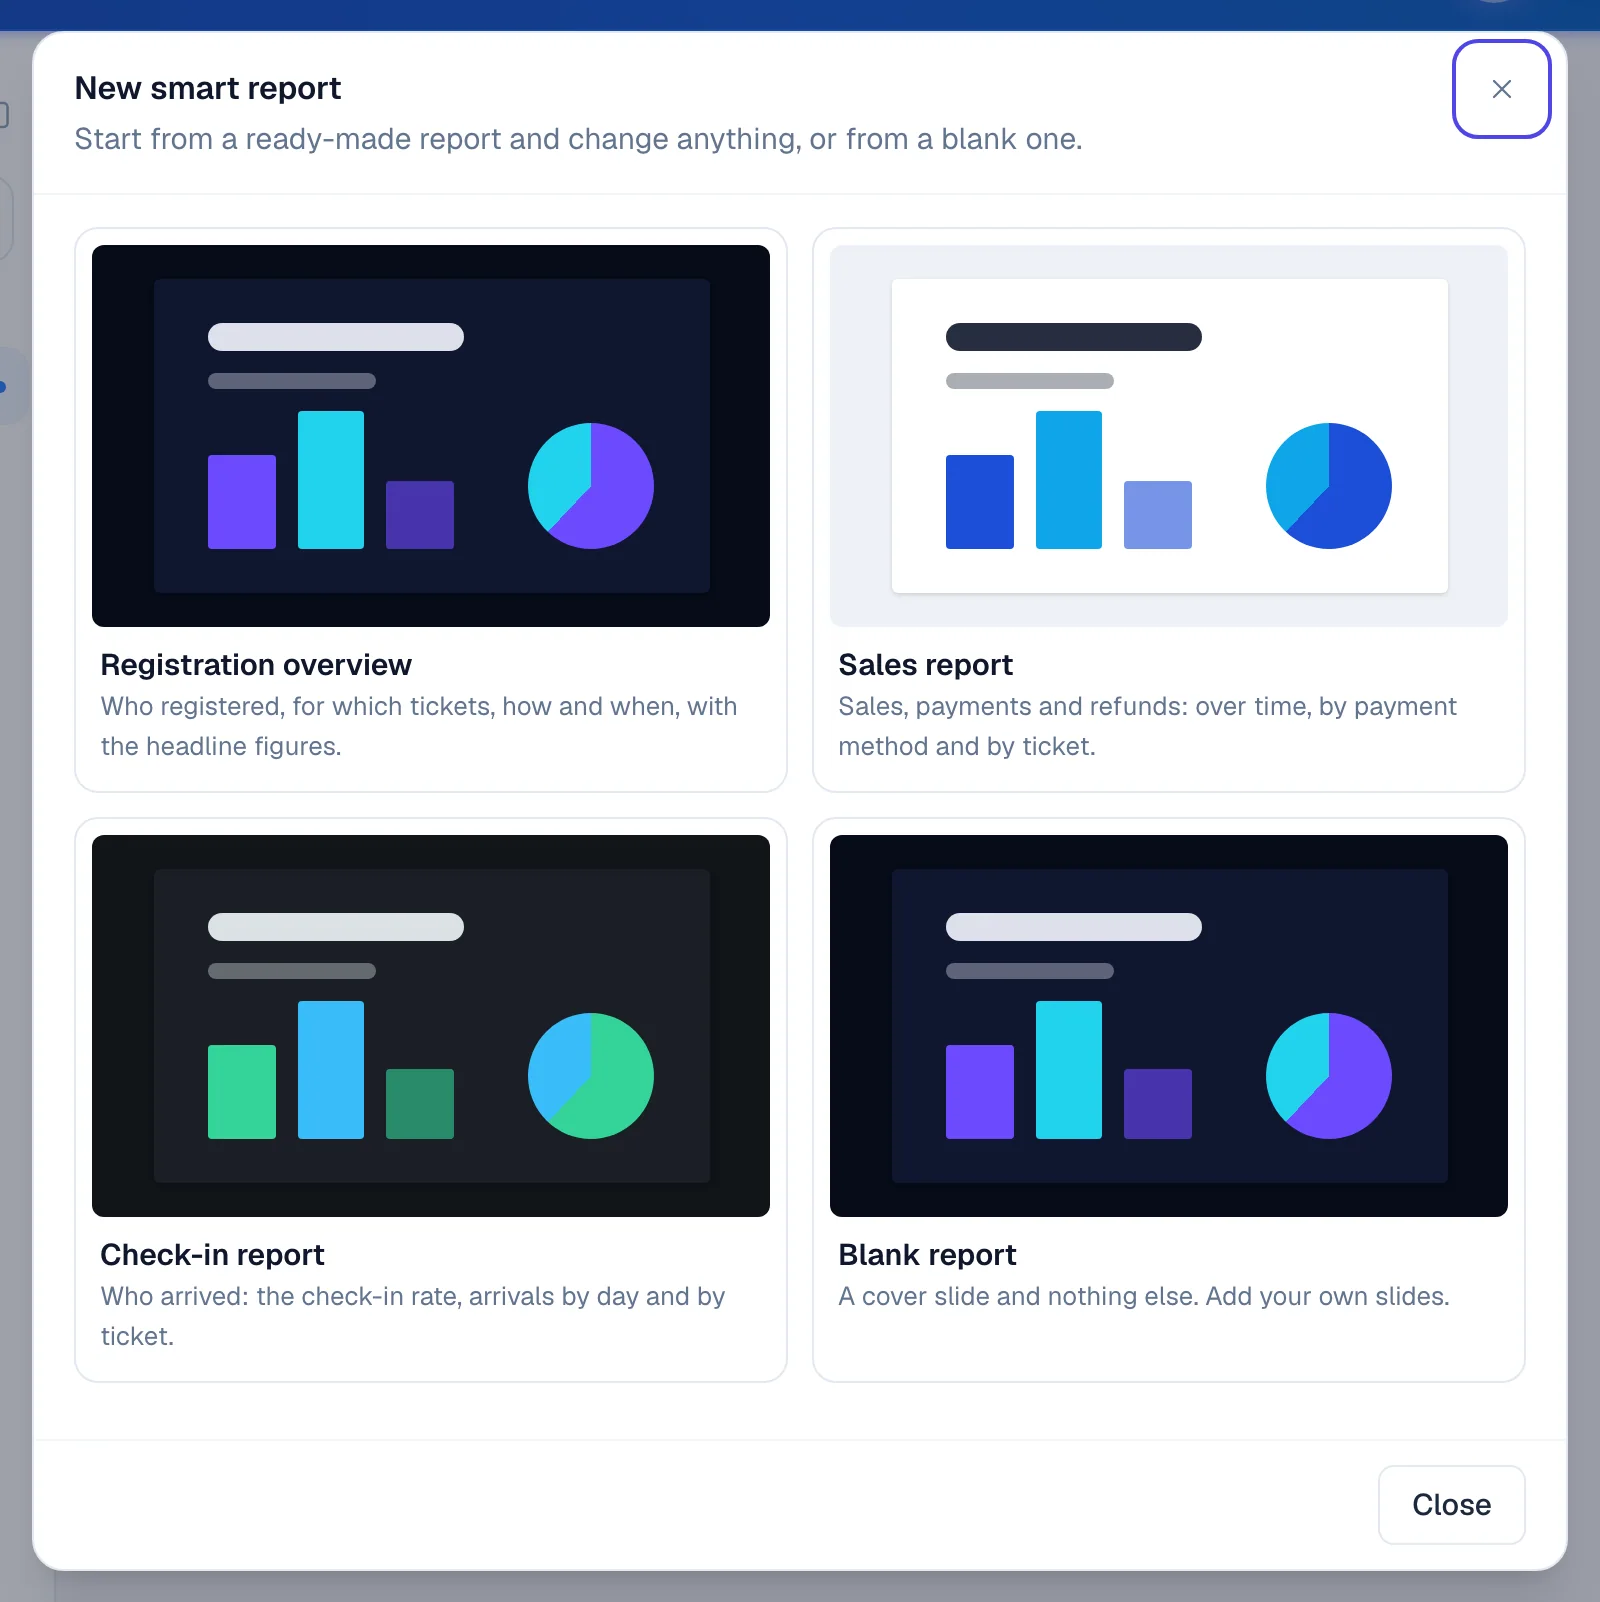
- Open Smart Reports and click New report.
- Pick a ready-made report: Registration overview, Sales report, Check-in report or Blank report. The report opens with today's figures.
- Click the name at the top to rename it.
- Change what it counts, its slides and its look (below).
- Click Save. The badge beside the name changes from Unsaved changes to Saved.
While a report is open, the figures above the slides say when they were worked out (Figures as of …). Click ↻ Refresh to work them out again from the latest registrations.
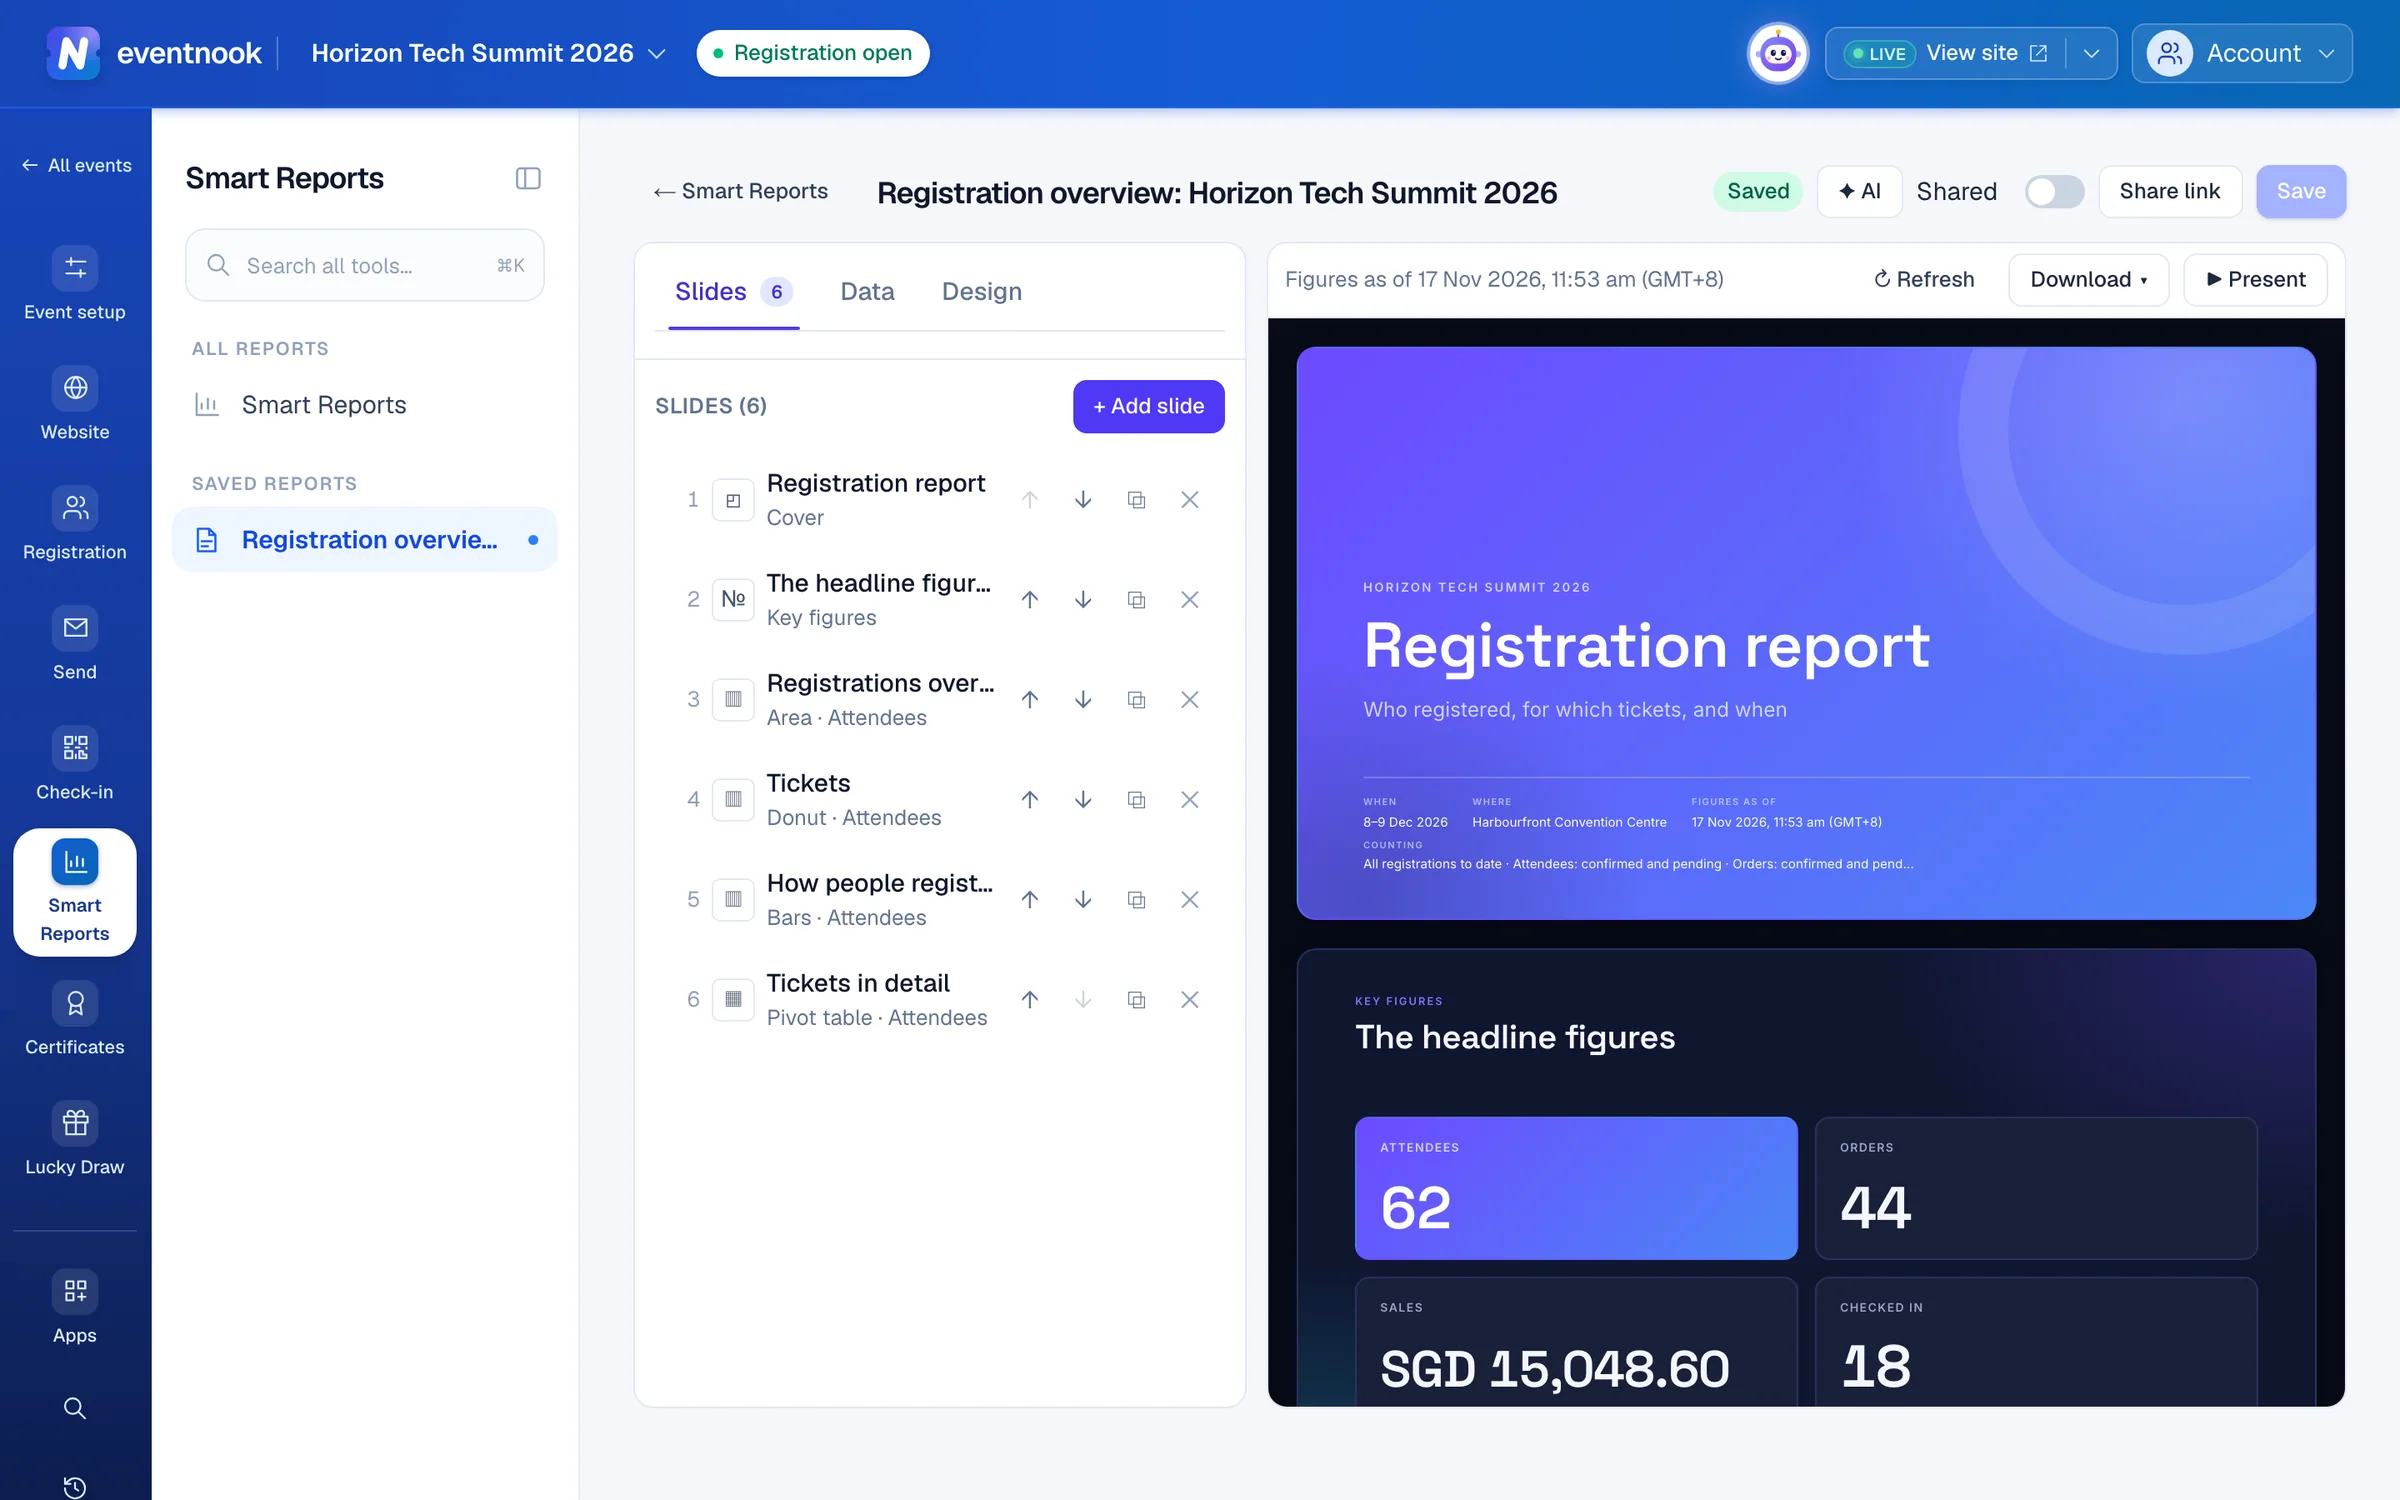
- 1What the report counts
- 2Add key figures, a chart, a pivot table or words
- 3Themes, colours, fonts and layout
- 4Show it full screen, one slide at a time
- 5Nothing is kept until you save
Choose what the report counts#
Open Data. What you set here narrows every slide of the report.
| Setting | What it does |
|---|---|
| Tables | Attendees (one row per ticket holder), Orders (one row per order), or both. Each slide summarises one of them. A table that slides still read can't be taken off. |
| Period | When people registered: Any time, In the last … days, This month or Between two dates, in the event's time zone. |
| Tickets and source | Only some Tickets, or only some ways people registered (How they registered). None ticked counts them all. Include test registrations counts test orders too. |
| Attendees | Their Status, Check-in (everyone, checked in only, or not checked in only) and Field filters on their answers. |
| Orders | Their Status, Free or paid, Payment method, Payment status and Field filters. |
Add slides#
- Open Slides and click + Add slide.
- Choose the kind of slide. It is added after the one you have selected.
- Type a Title and, if you like, a Subtitle and a Note.
- For a chart or a pivot table, choose what to Group by and the Figure to show for each group.
- Choose a Background: Plain, Tinted or Accent colour.
| Slide | What it shows |
|---|---|
| Cover | The title page. Show the event's name, dates and place adds them. |
| Section heading | A big heading that opens a new part of the report. |
| Key figures | Up to 6 headline numbers, such as attendees or sales. |
| Chart | Bars, Columns, Donut, Line or Area over a summary. |
| Pivot table | Groups down the side, figures across. |
| Words | A heading and your own words. Start a line with - for a bullet point. |
Use the ↑ and ↓ buttons on a slide's row to change the order. A report holds at most 30 slides.
Summaries in charts and tables#
- + Then by another field groups by a second field, such as ticket and then status.
- Across the top (columns) on a pivot table, or Split each group by (stacked) on a chart, adds a field across.
- Order sorts the groups (Largest first, A to Z …) and Show top sets how many show. Groups by date are always in date order.
- Only count… narrows one slide or one key figure further than the report. On a key figure with its own filter, Show as a percentage of the unfiltered figure turns it into a rate, such as the share of attendees who checked in.
Change the look#
- Open Design and click one of the 10 themes, such as Aurora or Boardroom.
- Optional: change its Colours, the Chart colours, in order of use, the fonts under Type, and the Cover, Slides and Backdrop styles under Layout.
- Click Save.
To undo your fine-tuning, click Back to … as it comes under the themes.
To describe the look instead, click ✦ AI (or ✦ Design with AI on Design) and say what you want, such as "a clean white corporate look". The AI changes the unsaved report and lists what it changed. Each answer has Undo these changes, and nothing is kept until you click Save.
Present, download or print#
- ▶ Present shows the report full screen, one slide at a time. Use the arrow keys, Space, Page Up and Page Down to move, and
Escor Exit to leave. - Download › Web page (HTML) saves one file that scrolls like a web page. Slideshow (HTML) saves one that shows a slide at a time. Both open in any browser.
- Download › Print or save as PDF prints one slide per page. Choose Save as PDF in the print dialog for a PDF.
Share a report#
With your team#
Switch on Shared beside the report's name. Everyone who can read the event's reports then sees it in their list, marked Shared. They can open, present and download it, but only you can change it: they click Duplicate to edit to make their own copy.
With people outside EventNook#
A share link opens the report for someone without an EventNook account, such as a sponsor or a client.
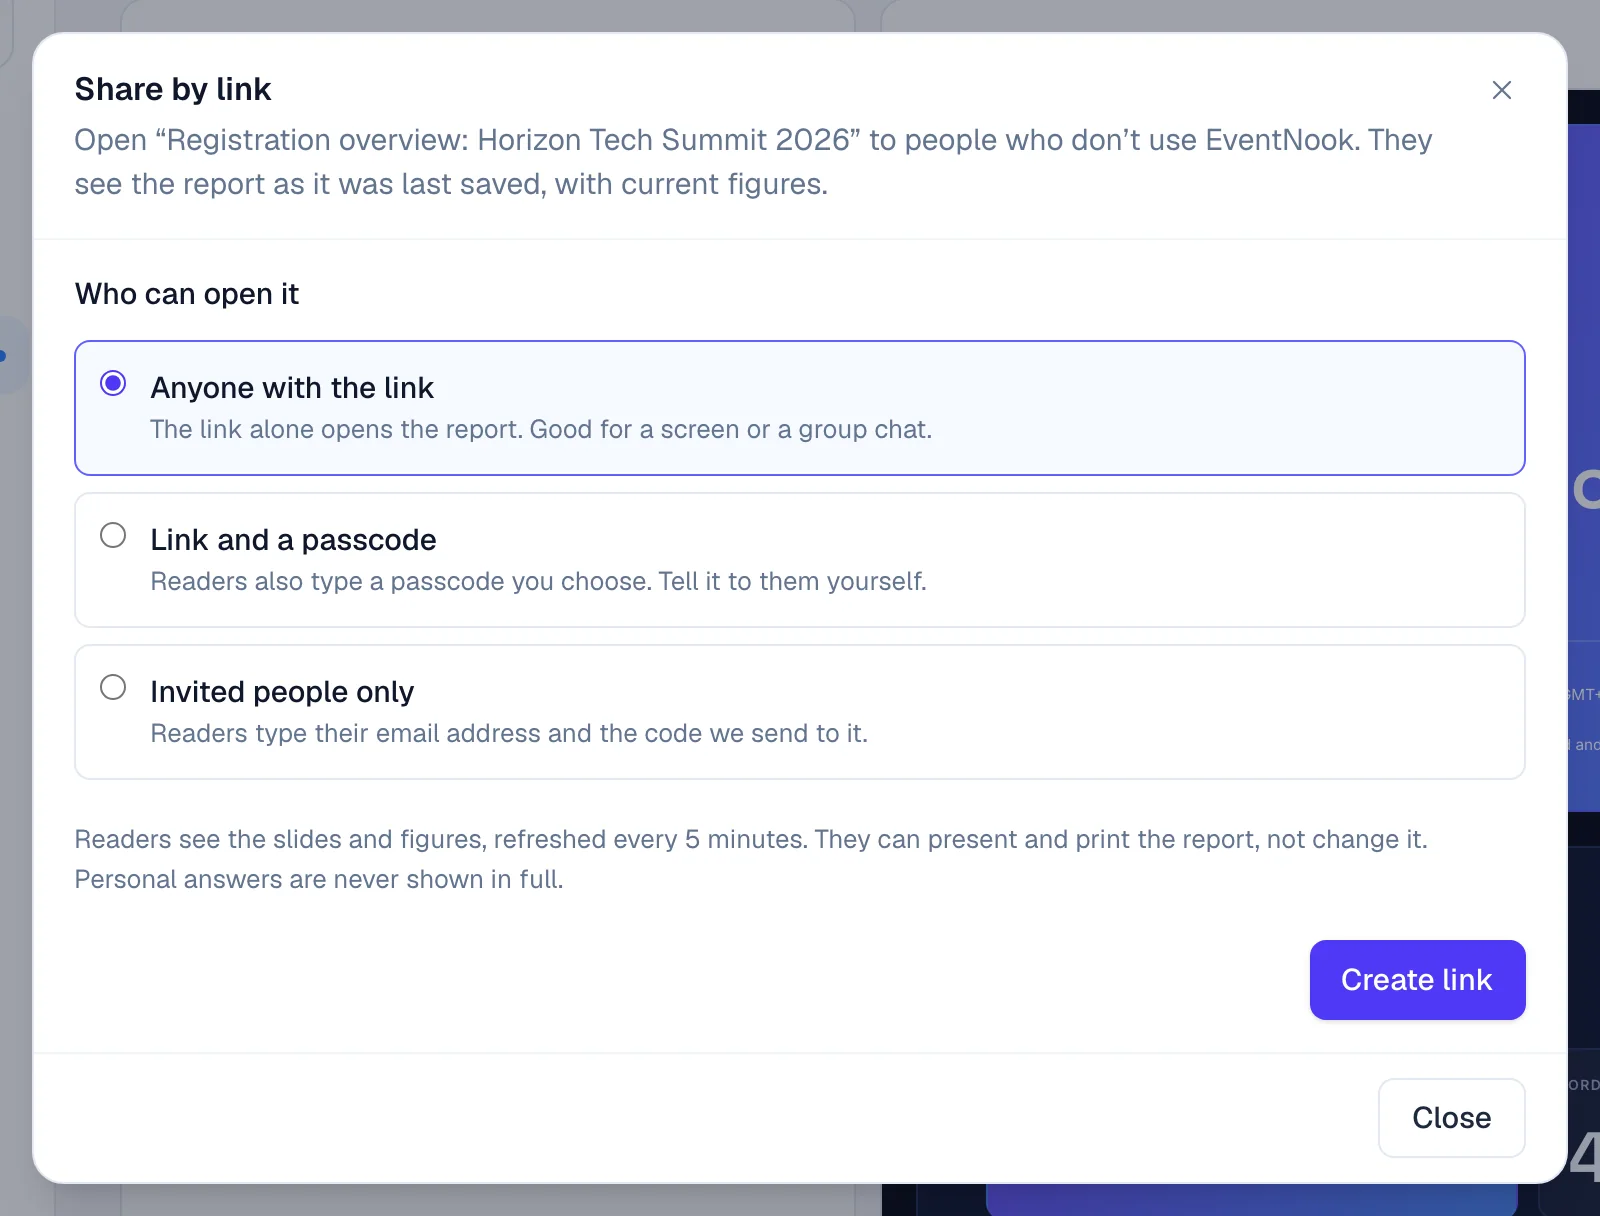
- Open the report and click Share link.
- Under Who can open it, choose how readers get in.
- Click Create link, then Copy link and send it.
| Choice | What readers do |
|---|---|
| Anyone with the link | The link alone opens the report. |
| Link and a passcode | They also type a passcode you choose, of at least 8 characters. Suggest one makes one. Tell it to them yourself. |
| Invited people only | List up to 200 email addresses. Each reader types their address and the code emailed to it, and stays in for 12 hours. |
Readers see the report as you last saved it, with figures refreshed every 5 minutes. They can present and print it, not change it, and personal answers are never shown in full. While the link is on, the button reads Share link · on.
To end it, open Share link and click Stop sharing: the link stops working at once. Replace link gives a new address and stops the old one, so you need to send the new link.
If something looks wrong#
- A slide says This slide has no figures, or a field reads Not on this event any more. A field it used may have been removed from the form. Select the slide and choose another field.
- A slide says Nothing to show. No registrations match the slide's fields and the report's settings under Data. Widen the Period or the statuses.
- Some groups are masked. The slide groups by a personal answer, which your role can't see in full. Group by another field, or ask an event admin.
- A figure differs from the Attendees or Orders list. Check Period, Tickets and source and the statuses under Data, and the slide's Only count….
- Save says the report was changed somewhere else. Reload the page to get the latest, then make your changes again.
- The report opens read-only. Someone else made it and shared it. Click Duplicate to edit.
- A reader says the link doesn't open a report. The link was stopped or replaced. Send them the current one.
Who can do this#
Everyone with access to the event's reports can make, save, present and download their own smart reports, and open the shared ones. Sharing a report with the team or by link needs the right to export. Only the person who made a report can change, share or delete it. An event admin can stop someone else's share link.
Related guides
- Add an app to your eventSee which add-on apps your plan includes, add one to an event so it joins the menu for the whole team, and take it off again when you no longer need it.
- Summaries, saved views and exportsCount attendees by up to three fields, manage the saved views of your reports, run your organisation's custom reports and see every export of the event.
- Read the event dashboardSee confirmed sales or registrations, places left, pending approvals and how each ticket is selling, and what needs your attention next.
Still stuck? In EventNook, ask HeyNook. It knows the page you're on and your event, and can take you straight to the right setting.